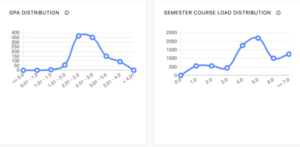
Analytics
One of the most exciting functional enhancements we gain from Stellic is requirements-based reporting and analytics.
Authorized users will have the ability to identify and engage with subsets of students based on a variety of student and requirements data. For example, a program coordinator could select students based not just on their academic year, GPA, or major, but by the number of requirements they have left, what courses are in their academic plan, and if they are missing specific requirements.
The image below displays an example of a filter an advisor could use: find all sophomores who are undeclared, and have more than 80 credits remaining.
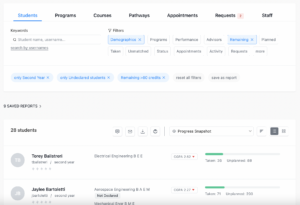
Once a population of students has been identified, they can be contacted either individually or collectively, a message can be sent to the whole sub-set that meets query criteria (via email and in-app messaging). Advisors and staff can also choose to download the results in a CSV.
Create and save tracked reports based on the search results
The filtered results from the student search can be saved as a tracked report. Each day, advisors and staff can start their day seeing if any new students have entered or exited the filters being tracked. Using these reports, staff can also set up automated communication on a recurring basis.
For example:
- Remaining Requirements: For a defined student population (e.g. students planning to graduate next year), what requirements are still remaining to be planned. This can be exported as a CSV.
- Student Bulk Progress: For a defined student set (using student filters), view an individualized degree progress report for each student, broken down by program, showing their progress towards meeting requirements.
Real-time reporting & analytics
Authorized users can access reports to get a “birds-eye view.” This reporting can deliver many insights that can inform decisions such as course offerings, curriculum modifications, faculty needs, and more.
The following is a student search that a staff member or administrator could conduct, where the result is a list of students:
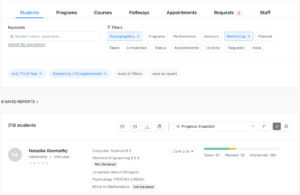
This student filtering system can help conduct ad-hoc searches utilizing hundreds of criteria, allowing you to both view the results in real-time and download the results. These ad-hoc search criteria can then be saved to transition to a static report that can be run anytime manually, or configured to auto-run daily and inform staff when new students enter into it.
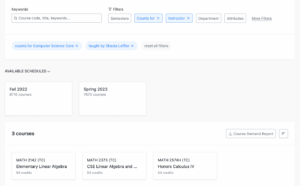
Similarly, the same filtering system is available for Courses and Programs. Here’s an example of searching for Courses that filter by requirement and instructor.
Audit Analytics
Audit analytics provides an aggregated table of how many students in a particular program at GMU have requirements remaining, completed, or planned for upcoming semesters.
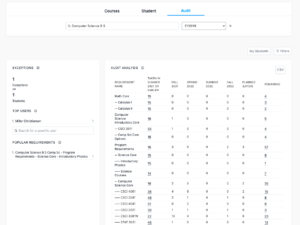
Each item in the report is clickable to quickly see the courses for each requirement and the distribution of students who are taking them. For example, this report shows that in the Multivariable Calculus Requirement in the Engineering Major, most students are taking CSE Multivariable Calculus and Vector Analysis (MATH 2374) to fulfill that requirement.
This reporting can be used to inform many decisions, including course offerings, curriculum changes, and instructor needs.
Remaining Requirements Report
Similarly, you can run a report of only the remaining requirements for a selected group of students, which proves to be extremely helpful in tracking common bottlenecks to graduation, preparing for degree clearance, and allocating course resources to ensuring students can graduate on time. With one click, users can download this report as a CSV, which will include data columns about when each student’s audit was last computed.
 |
 |
Course Analytics
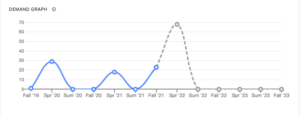
In the analytics tab, users can see visual reports of course demand, in addition to other insights regarding courses and instructors.
Course Overlap
For specific courses, administrators can understand the other courses that students frequently take concurrently. Similarly, this helps inform decisions around course offerings, curriculum, and resource allocation.

Time Distribution
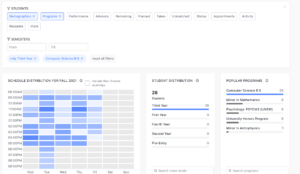
Also provided is an aggregated report on what times are busy for a given student population, including their co- curricular activities. When a new course or section needs to be offered within a program or across a particular student population, this helps inform when students are available.
Course-Program Mapping
For specific courses, users can visualize the distribution of programs of the students who are taking or have taken that course.

Course-Level Mapping
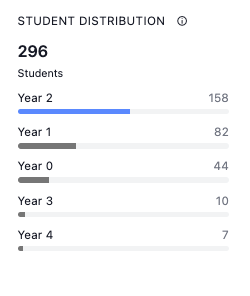
For specific courses, users can visualize the distribution of class level of the students who are taking or have taken that course.
Course Load vs GPA Correlation
Based on student group (or status), admins can visualize the correlation of course load to GPA distribution. This can be segmented based on student tags and levels.
